

Why Do Tests Fail Now and Then? Flaky Tests Explained with Small Node.js Experiments
A flaky test depends on something other than the code, and the way to find out what is to run it many times and count.
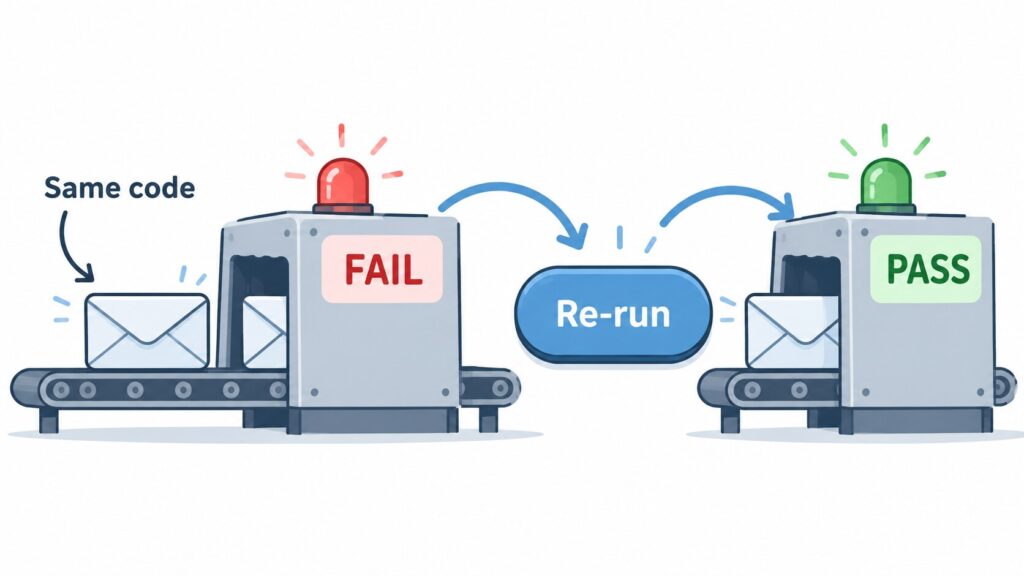
You push a change and CI goes red. You open the log, and the failure looks unrelated to what you touched. You hit “re-run” without much hope, and this time the build is green.
You did not change a single line. So why did the result change? This article answers that with a handful of small experiments you can reproduce on your own machine.
This kind of test has a name
A test that produces both a pass and a fail for the same code is called a flaky test. That is how the Google Testing Blog defines it in its post on flaky tests. If “unreliable” is the word that comes to mind, you have the right idea.
What matters is why the result changes. Ideally a test result depends on the code and nothing else. A flaky test also depends on something besides the code. So the essence of flakiness is that the test depends on something other than the code.
Google’s post lists several causes, including concurrency (several things running at the same time), reliance on non-deterministic behavior (behavior that can differ from run to run), and infrastructure problems (trouble with the environment the tests run in). The three buckets used below (run order, shared resources, and time) are my own grouping, chosen because each one is easy to reproduce locally. They are not Google’s classification.
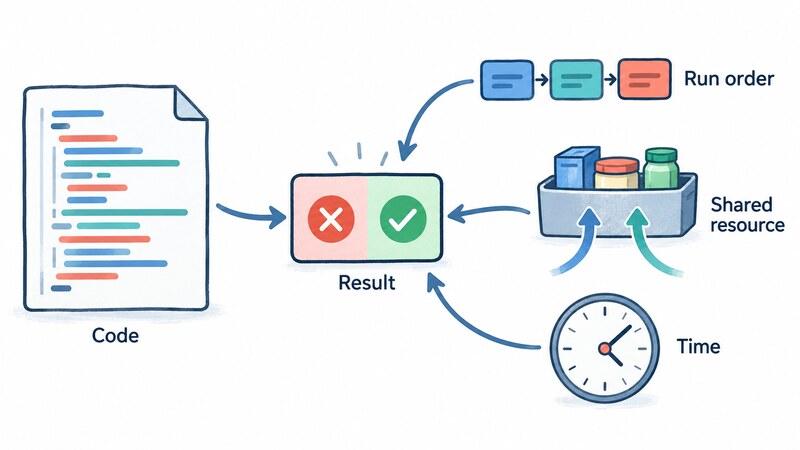
Every experiment below uses the built-in Node.js test runner (node:test, the tool that finds tests, runs them, and summarizes the results). I ran them with Node.js v22.12.0 on a Windows 11 machine. The numbers are from this environment and will differ a lot on other machines.
Cause 1: a test relies on what an earlier test left behind
The first example is run order. In this file, the second test assumes that the first one has already put an item in the cart.
import test from 'node:test';
import assert from 'node:assert/strict';

const cart = [];

test('adds an item', () => {
  cart.push('apple');
  assert.equal(cart.length, 1);
});

test('cart has one item', () => {
  assert.equal(cart.length, 1);
});
Run the whole file and both tests pass. But select only the second test by name, and it fails: the first test never ran, so cart is still empty.
$ node --test order.test.js
# pass 2
# fail 0

$ node --test --test-name-pattern="cart has one item" order.test.js
not ok 1 - cart has one item
  expected: 1
  actual: 0
# pass 0
# fail 1
The output above is an excerpt. If the run order is the same every time, the result is the same every time. In this experiment the failure reproduced deterministically, not “now and then”. In an environment where the order changes from run to run, I would expect the same test to pass sometimes and fail sometimes. I did not measure that here, so treat it as how an order dependency would show itself, not as a result.
Cause 2: two tests touch the same thing at the same time
The second cause is a shared resource. By default, the Node.js v22 test runner runs each test file in its own process, in parallel. If two files rewrite the same temporary file, each can end up reading the other’s write.
import test from 'node:test';
import assert from 'node:assert/strict';
import fs from 'node:fs/promises';
import os from 'node:os';
import path from 'node:path';

const file = path.join(os.tmpdir(), 'flaky-sandbox-shared.txt');

test('shared-a writes and reads back its own value', async () => {
  for (let i = 0; i < Number(process.env.ITER ?? 50); i++) {
    await fs.writeFile(file, 'value-from-a');
    const text = await fs.readFile(file, 'utf8');
    assert.equal(text, 'value-from-a');
  }
});
This is shared-a.test.js. shared-b.test.js has the same shape and only writes value-from-b instead. Each test just reads back the value it wrote, so run alone it has no reason to fail.
To see “now and then”, the quickest way is to run the same thing many times and count. I used a small program, run-many.js, that launches the test run N times and counts the failing test names from lines starting with not ok. Here is the gist:
import { spawnSync } from 'node:child_process';

const runs = Number(process.argv[2]);
const files = process.argv.slice(3);
const perTest = {};
let failingRuns = 0;
for (let i = 0; i < runs; i++) {
  const r = spawnSync('node', ['--test', '--test-reporter=tap', ...files], { encoding: 'utf8' });
  const failed = [...r.stdout.matchAll(/^not ok \d+ - (.+)$/gm)].map((m) => m[1]);
  if (failed.length > 0) failingRuns++;
  for (const name of failed) perTest[name] = (perTest[name] ?? 0) + 1;
}
console.log(JSON.stringify({ runs, failingRuns, perTest }, null, 2));
I ran just these two files 100 times in parallel with ITER=10, and 11 of the runs failed. With --test-concurrency=1, which sets the concurrency to one, all 100 runs passed. The output below is an excerpt. runs is the number of runs, failingRuns is the number of runs with at least one failure, and perTest is the failure count per test name.
### shared only, parallel, ITER=10
  "runs": 100,
  "failingRuns": 11,
  "perTest": { "shared-a writes and reads back its own value": 11 }

### shared only, --test-concurrency=1, ITER=10
  "runs": 100,
  "failingRuns": 0,
  "perTest": {}
--test-concurrency=1 runs only one test file at a time. But all it does is keep the collision from happening. Turning off parallelism is a workaround; the cause, two tests sharing one file, is still there.
So how do you fix it at the root? Give each test its own file name.
To try that, I made own-a.test.js and own-b.test.js, which differ from shared-a.test.js only in the file name and the test name. Run in parallel 100 times, they failed 0 times out of 100. The likely reason is that there is no longer any room for a collision. Still, 100 runs cannot completely rule out that zero failures was just luck.
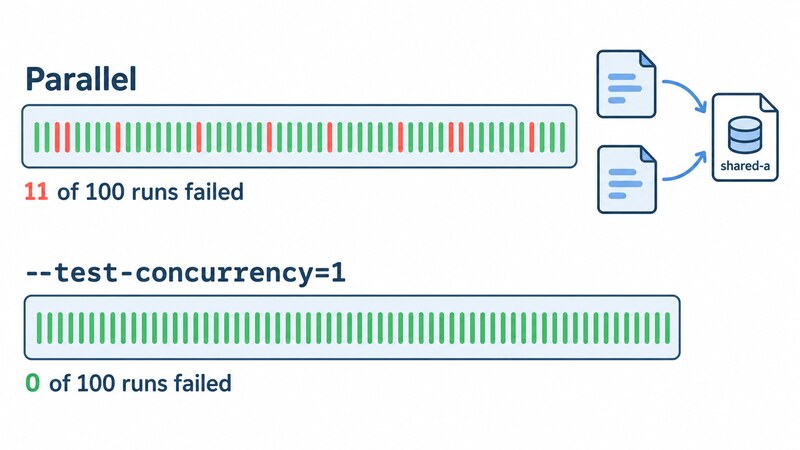
One more observation. In that 100-run measurement with only shared-a and shared-b, only shared-a failed; shared-b never did. I did not investigate why, so I will not speculate. In the 300-run measurement in a later section, shared-b did fail twice.
Cause 3: a time limit with no headroom
The last cause is time. An assertion like “this finishes within 100 milliseconds” looks like a perfectly serious test. But the time a task takes varies a little on every run, even on the same machine.
import test from 'node:test';
import assert from 'node:assert/strict';

const limitMs = Number(process.env.LIMIT_MS ?? 50);

test('sorting 200k numbers finishes within the limit', () => {
  const data = Array.from({ length: 200_000 }, () => Math.random());
  const start = performance.now();
  data.sort((x, y) => x - y);
  const elapsed = performance.now() - start;
  assert.ok(elapsed < limitMs, `took ${elapsed.toFixed(1)} ms, limit ${limitMs} ms`);
});
I first timed it 30 times on its own. The median (the middle value when the timings are sorted) was 75.2 ms, with a minimum of 67.9 and a maximum of 100.3. I set the limit a little above the median, with LIMIT_MS=100.
With that limit, I ran all three files (including the shared-file tests above) 100 times with ITER=3. In parallel, 17 runs failed. With concurrency set to 1, so the timing test no longer competes with the other tests, the count dropped to 9. Each figure is a single set of runs, so the difference may be within run-to-run variation. I cannot claim that reducing the load lowers the failure rate; all I can say is that the count looked lower and was still not zero. My reading is that the limit sits close to the slow end of the timing distribution, which is why some runs fail.
### parallel (default)
  "failingRuns": 17,
  "perTest": { "sorting 200k numbers finishes within the limit": 17 }

### --test-concurrency=1
  "failingRuns": 9,
  "perTest": { "sorting 200k numbers finishes within the limit": 9 }
Other work on the same machine also affects the timing, so the rate changes from one batch to the next. In another batch (ITER=10), the same timing test failed in 21 of 100 runs. An unstable rate is itself a mark of a flaky test.
How to find out: run it dozens of times and see which test failed
How do you check whether a test is flaky? The answer is simple: without changing the code, run the same test dozens of times and count how often it fails. Every figure so far, such as “11 of 100” and “17 of 100”, came from exactly this method.
The rate depends a lot on the environment. With the same settings (all three files in parallel, ITER=10), one batch failed only 3 times in 100 runs, while another failed 127 times in 300. I suspect machine load, such as whether other processes were running, but I did not isolate the cause. So do not trust a single number. Repeat the runs, look at the rate, and expect the rate to move with the environment.
When you count, do not look only at the number of failures. Here are the results of the 300-run batch (an excerpt):
  "runs": 300,
  "failingRuns": 127,
  "perTest": {
    "shared-a writes and reads back its own value": 39,
    "sorting 200k numbers finishes within the limit": 111,
    "shared-b writes and reads back its own value": 2
  }
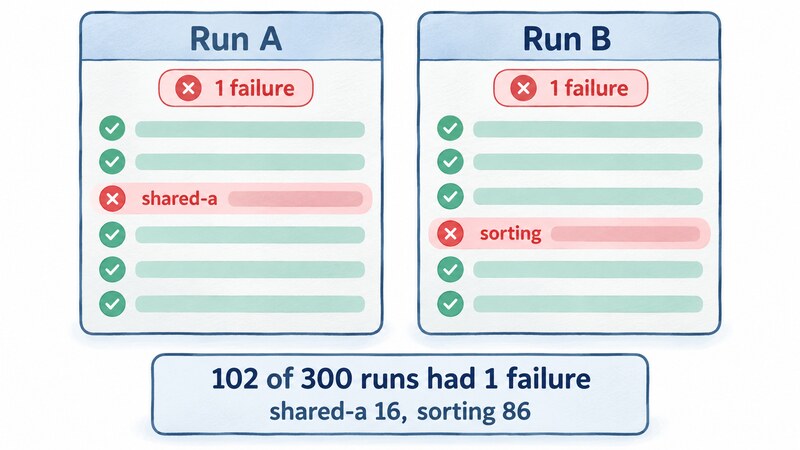
by failure count {"0":173,"1":102,"2":25}
{"pairsWithSameNonZeroCount":5451,"ofWhichDifferentMembers":1422}
The last two lines come from recording the names of the failing tests in each run and tabulating them separately. They are not part of the gist of run-many.js shown earlier.
There were 102 runs with exactly one failure. But when I looked inside them, they split into 16 runs where only shared-a failed and 86 runs where only sorting (the timing test) failed. Run 7 failed only on shared-a, and run 48 failed only on sorting. Both are “1 failure”, yet the failing tests differ.
Comparing the runs that had at least one failure, 5,451 pairs had the same failure count, and in 1,422 of those pairs the names of the failing tests differed. That number comes from an all-pairs comparison of runs, so it is a rough indicator and not an estimate of any rate. It is still enough to show why you should look at which test failed, not just how many.
The retry trap
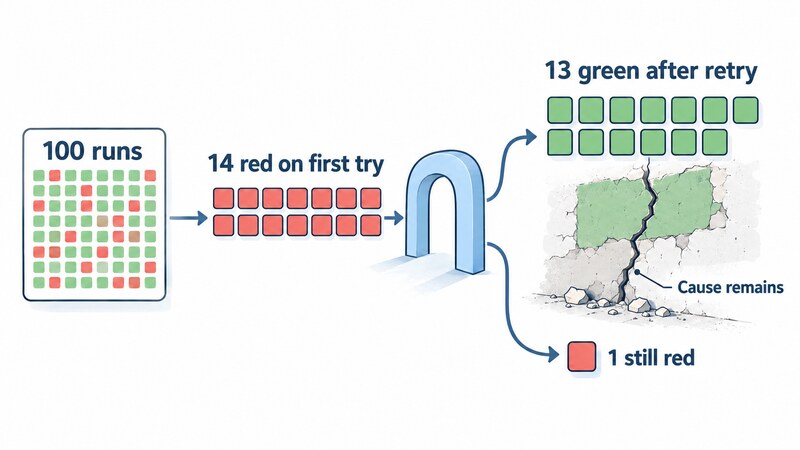
If a test fails, why not just re-run it until it turns green? Google’s post does list automatic re-running as one way to reduce the problem. I tried a policy where, if the whole suite is red, it is attempted up to 3 times in total (at most 2 re-runs). Over 100 sessions, the first attempt was red in 14. Of those, 13 turned green on a re-run, and only 1 ended red.
import { spawnSync } from 'node:child_process';

const files = ['shared-a.test.js', 'shared-b.test.js', 'timing.test.js'];
let firstAttemptRed = 0, finalRed = 0, retriedThenGreen = 0;
for (let s = 0; s < 100; s++) {
  let green = false, attempts = 0;
  while (!green && attempts < 3) {
    attempts++;
    const r = spawnSync('node', ['--test', ...files], { encoding: 'utf8', env: { ...process.env, LIMIT_MS: '100', ITER: '10' } });
    green = r.status === 0;
  }
  if (attempts > 1) firstAttemptRed++;
  if (!green) finalRed++;
  if (attempts > 1 && green) retriedThenGreen++;
}
console.log(JSON.stringify({ sessions: 100, firstAttemptRed, retriedThenGreen, finalRed }));
r.status is the exit code, where 0 means success. The result:
{"sessions":100,"firstAttemptRed":14,"retriedThenGreen":13,"finalRed":1}
Of the 14 red runs, 13 disappeared from the final result. Yet nothing about the tests was fixed. The problem is not the retry itself. It is that the first failure goes unrecorded and only the final green gets looked at. If you count first-attempt failures, you can track the same kind of rates this article has been measuring.
Every test in this experiment is flaky and none contains a real bug, so I did not measure whether a real bug would be hidden in the same way. What Google’s post says is that a failure written off as “just flaky” can later turn out to have been a real bug. The reasoning is that re-running reduces failures but can also push people toward ignoring flakiness.
Wrapping up
A flaky test gives different results for the same code, and the essence of it is a dependency on something other than the code. Run order, shared resources, and time can each be reproduced in a small example.
To find a flaky test, run it dozens of times and look at both the failure rate and which test failed. The rate changes with the environment, so look across many runs, not at one number. Retries can help reduce the noise, but do not stop there: keep a record of the first-attempt failures.
The direction of the fix depends on the cause:
- Run order: have each test set up the state it needs itself. (This direction was not measured.)
- Shared resources: give each test its own path. In my measurement this gave 0 failures in 100 runs, even in parallel.
--test-concurrency=1is only a workaround that avoids the collision. - Time: leave headroom in the limit, or write the test so it does not depend on clock time or elapsed time at all. (This direction was not measured.)
The next time CI goes from red to green, do not stop at “it passed on re-run”. Ask once what the test was depending on.
Primary sources
- Flaky Tests at Google and How We Mitigate Them (Google Testing Blog) (definition of a flaky test, causes, and how re-running is treated)
- Test runner | Node.js v22 Documentation (running each test file in a separate process, and
--test-concurrency)